
The short answer Use Excel if a few people use the report and they also type data into it. Use Power BI if many people need to see it, it should update by itself, or your data has outgrown a spreadsheet. Most small businesses should start in Excel, because that work carries over if you move later.
Think of it like thisExcel is a notebook: you write in it and work things out. Power BI is the scoreboard on the wall: nobody writes on it, and everyone can see the latest score.
Take the 30-second quiz
Which one fits you?
This is a rule of thumb, not a law. If people need to type data into the report itself, that usually points back to Excel.
Side by side
| Excel | Power BI | |
|---|---|---|
| Best for | A few people, working in the file | A team viewing the same report |
| Typing data in | Yes, that’s what it’s for | Not really; it reads data from elsewhere |
| Updating | When someone opens and refreshes it | By itself, on a schedule |
| Sharing | Send a file; copies can get out of step | One report, everyone sees the same thing |
| How much data | Up to 1,048,576 rows, and slow well before that | Far more |
| Learning it | Your team probably knows it | Easy to read, harder to build well |
| Cost | Usually part of Microsoft 365 | Free to build, paid per person to share |
What Power BI really costs
You can build reports for free: Power BI Desktop is a free Windows download. You pay for sharing. Normally both the person sharing and the people viewing need a paid licence. Prices change, so check Microsoft’s current pricing and count your viewers before you decide.
The bigger costFor either tool, it’s the hours spent building it and agreeing what the numbers mean. The licence is usually the smaller part.
Two real examples
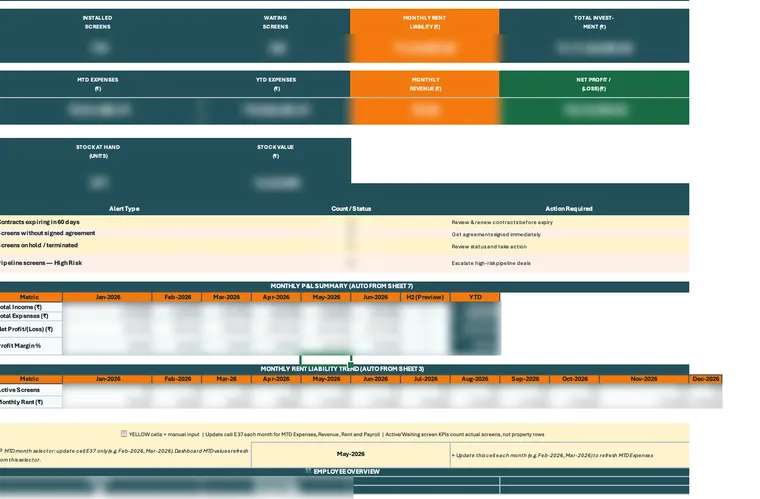
A screen-installation business runs on Excel
They track stock, installations, contracts, rent and payroll, and staff enter data directly. So the report and the data entry needed to live together. We built one workbook that catches typing errors as they happen and warns about contracts expiring within 60 days. Read the case study.
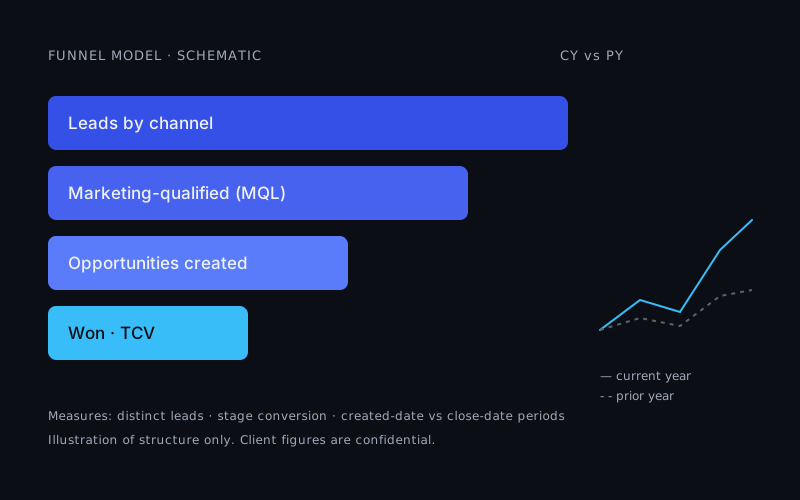
A B2B company needed Power BI
This team had a lot of marketing and sales data, and different reports kept giving different answers to the same question. They needed one definition of each number, and fair comparisons between periods. Power BI gave them that. Read the case study.
The sensible path: start in Excel
You don’t have to choose forever. Excel and Power BI share a tool called Power Query, which cleans and combines your data. Set it up once, and it can move with you.
- Write down your 5 to 8 numbers, and how each one is worked out.
- Connect your data with Power Query in Excel, instead of copying and pasting.
- Use it for a month or two. You’ll see which numbers people actually look at.
- Move to Power BI when you hit a limit: too many viewers, too much data, or nobody remembering to refresh.
The mistake that kills both
Use the 12 numbers owners check to choose yours. If ad numbers feed your report, read how to check Meta’s ROAS against real orders first.
Questions owners ask
Can Power BI use my existing Excel files?
Yes. Power BI can read Excel files directly, and many reports start that way.
Do I need a licence just to look at a Power BI report?
Usually, yes. Viewers normally need a paid licence too, unless your company has bought a larger plan. This often decides it for small teams, so count your viewers first.
Does Power BI work on a Mac?
Power BI Desktop runs only on Windows. People on a Mac can view shared reports in a browser, but building them usually needs a Windows machine.
Still not sure? On a free call we’ll look at your data and recommend one, including any licence cost. Your Business Dashboard in 10 Days can be built in either.